Find minimum and maximum value in a column
This quick action helps you identify extremes in a column in a numerical table.- In your workflow, go to + Add step > Integrations > Quick action.
- Select the Find min/max in column operation.
- Enter table data or use {} to refer to a table already used in the workflow. Note that the table data needs to have a 2D array structure.
- Select the column to analyze - enter 0 for the first column, 1 for column number 2, or 2 for column number 3 (and so on…).
Find unique values
This quick action helps you list unique values from a column. If the same value has been used 5 times (over 5 rows in a column), it will be listed only once in the output.- In your workflow, go to + Add step > Integrations > Quick action.
- Select the Find unique values in columns operation.
- Enter table data or use {} to refer to a table already used in the workflow. Note that the table data needs to have a 2D array structure.
- Select the column to analyze - enter 0 for the first column, 1 for column number 2, or 2 for column number 3 (and so on…).
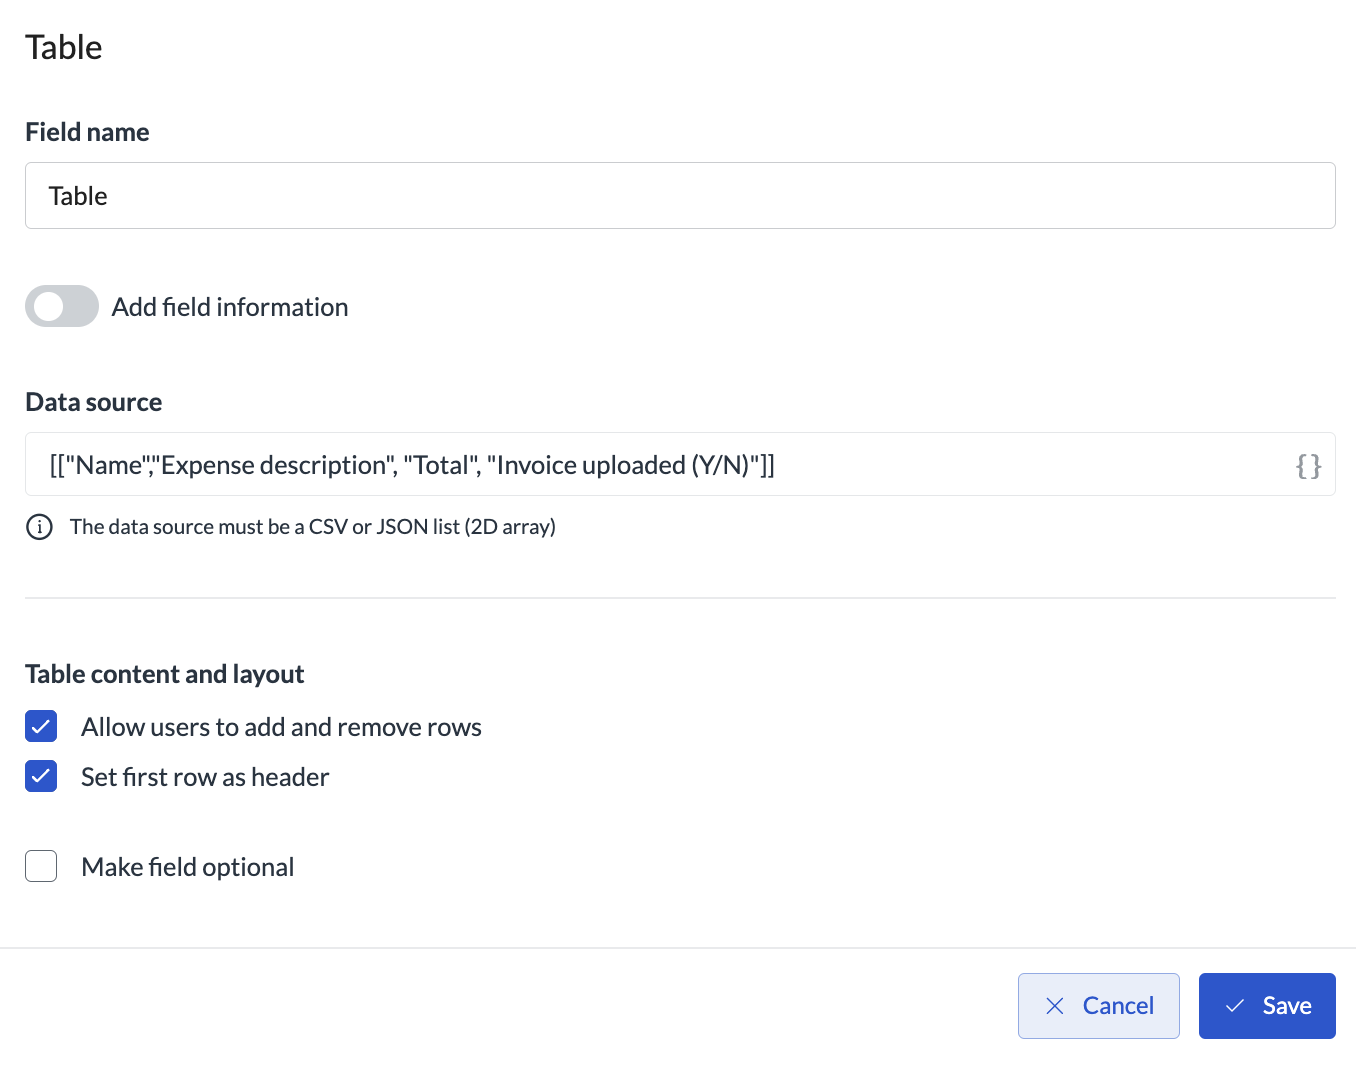
2D array structure
If you manually enter the table, make sure it has the following data structure: